PropertyDirector case study cover

PROPERTYDIRECTOR · Senior Product Designer · 2022–present

PropertyDirector

An all-in-one digital ecosystem for Australian property investors — consolidating market research, deal analysis, portfolio forecasting and digital bookkeeping into one trusted cloud platform.
SaaSTeam of 52022–present

Objective

To eliminate the reliance on paper records and disparate spreadsheets by providing a “bird's-eye” and “granular” view of a property portfolio — empowering investors with data-driven confidence to evaluate new deals and manage existing assets with 10-year forecasting precision.

Discovery

Discovery surfaced three investor archetypes:

  • The Aspiring Accumulator — hunting the next deal, leaning on the Deal Analyser and Market Activity Reports to avoid a $500k mistake.
  • The Portfolio Planner — already owns 2–5 properties, uses the Portfolio Forecaster to visualise wealth 10 years out and decide when to buy again or retire.
  • The Organised Landlord — focused on the now, uses Digital Bookkeeping to kill the paper trail and stay tax-ready across unlimited properties.

Pains

  • Data fragmentation — one site for research, another for bank feeds, a spreadsheet for forecasting.
  • The “crystal ball” problem — no easy way to predict how a purchase affects long-term wealth without complex manual math.
  • Audit anxiety — fear of losing physical receipts needed for capital gains tax or annual returns.
  • Analysis paralysis — overwhelming suburb data that's hard to synthesise into a buy/no-buy decision.

Hypotheses

  • H1 — One-stop shop: centralising bookkeeping and research in one login increases retention because the platform becomes a daily utility, not a monthly research tool.
  • H2 — Data-driven confidence: 30 years of historical suburb data in the Forecaster reduces investor anxiety and increases deal-flow.
  • H3 — Accessibility of insights: pairing “bird's-eye” and “detailed” reporting satisfies both the high-level strategist and the detail-oriented accountant.

Journey

A cyclical investor loop: Research a suburb via Market Activity Reports → Evaluate a specific address with the Deal Analyser → Acquire and add the asset to Digital Bookkeeping → Monitor monthly cash flow and expenses → Forecast the next move against a 10-year Portfolio Forecaster.

Sitemap

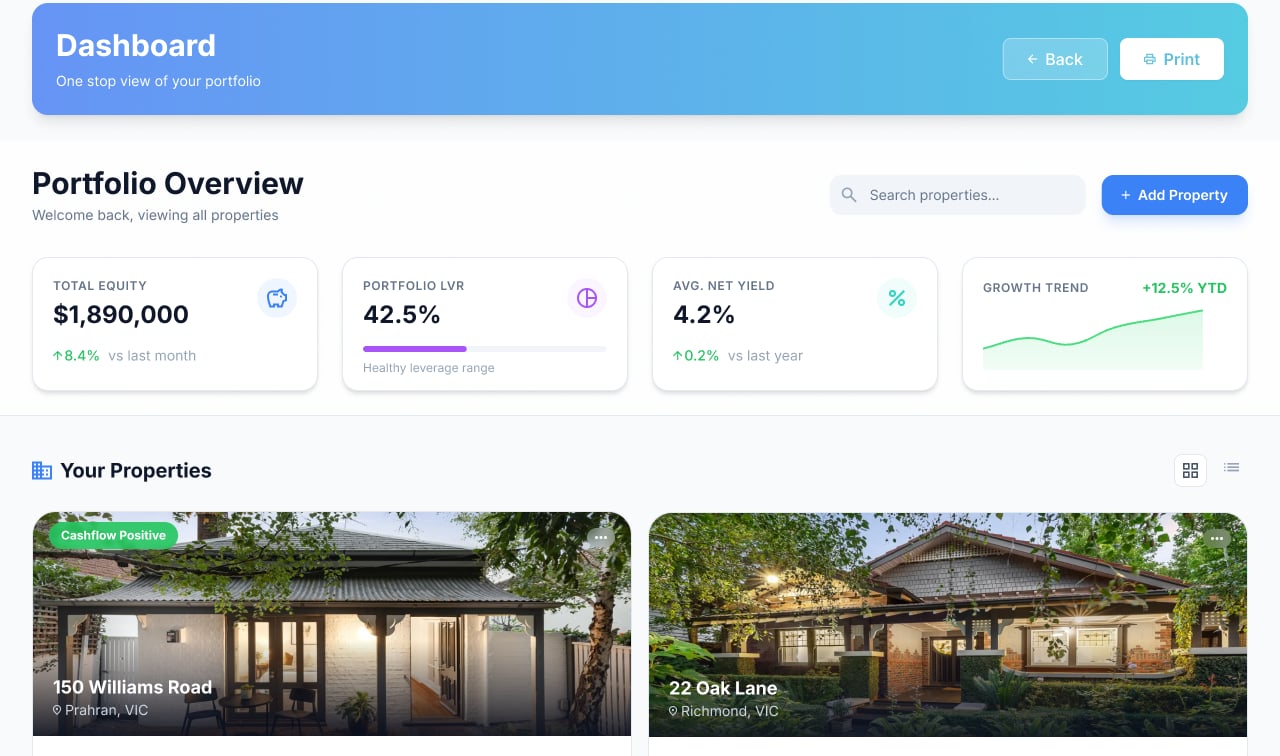
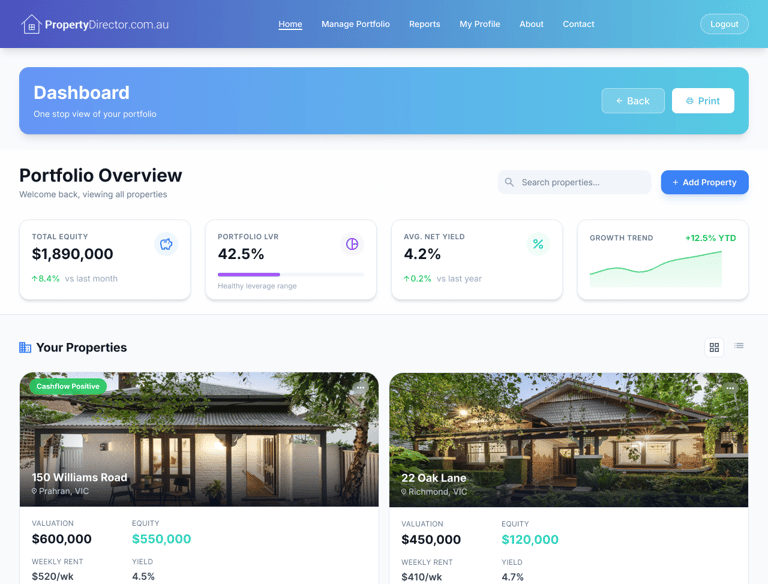
  • Dashboard — high-level portfolio value and cash flow summary.
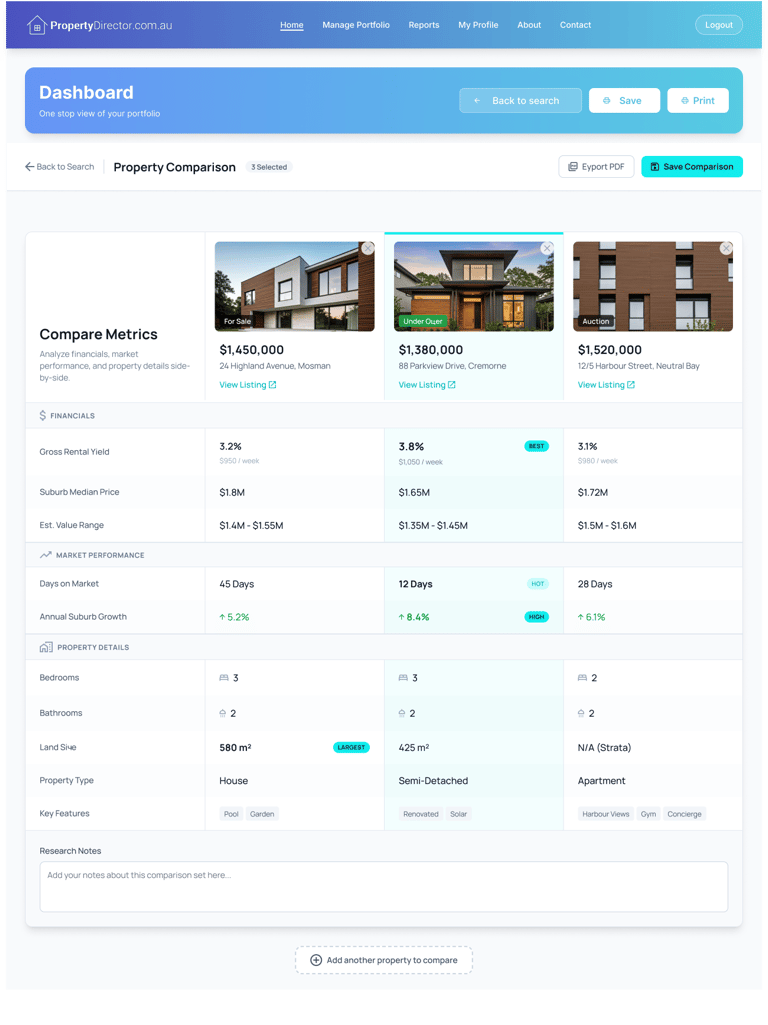
  • Research Hub — suburb research, market activity and Deal Analyser tools.
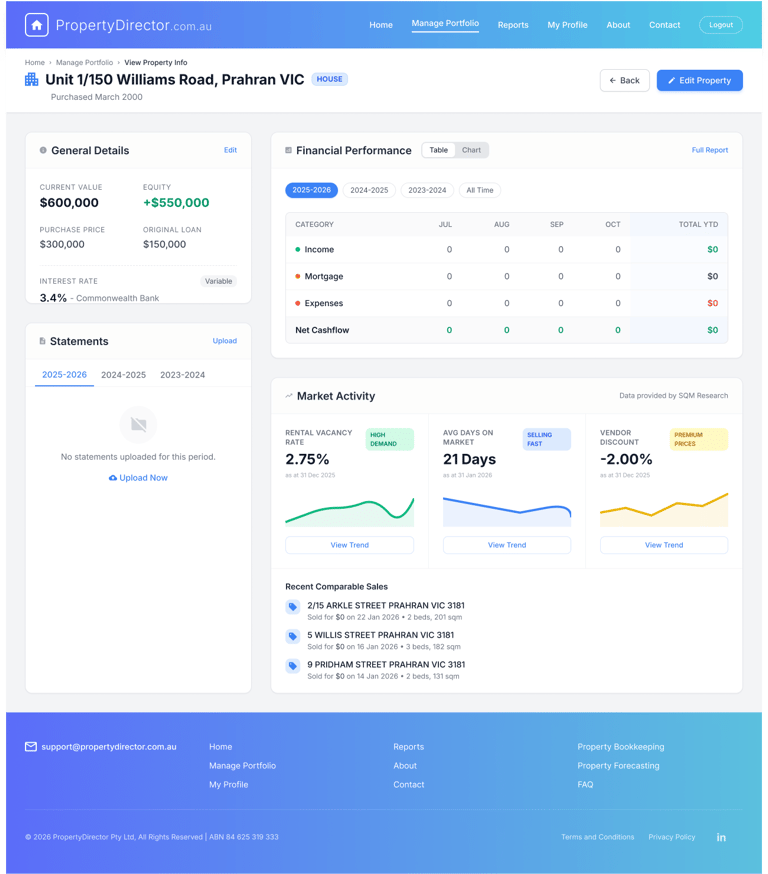
  • Portfolio Manager — property-specific folders, document storage and bookkeeping.
  • Reporting Suite — 10-year growth projections and tax-ready financial statements.

Design approach

Built mobile-responsive from the start: a clean Forecasting View line chart with a historical-data toggle, and a Bookkeeping interface with a Quick-Add transaction button plus a document-upload zone that mimics a digital filing cabinet.

Test results

Qualitative: interviews with “Spreadsheet Power Users” to test whether Digital Bookkeeping could realistically replace their manual workflow. Quantitative: “Time-to-Task” testing — how long it takes to generate a 10-year forecast versus doing it manually.

Conversion metrics

  • Trial-to-paid ratio — investors moving from free suburb searches to full portfolio management.
  • Report generation — Deal Analyser reports run per user, a lead indicator of active investing.
  • Document upload volume — a proxy for how “sticky” the digital vault becomes.

Success evidence

  • User retention through tax season (July–October).
  • Forecast accuracy — alignment of projections with actual market growth over 12-month cycles.
  • NPS — expected to run high if the platform genuinely eliminates the need for paper records.

Want the full deck?

This page covers the shape of the project. If you're hiring or shortlisting, I'm happy to walk through research artefacts, Figma files and the metrics behind the headline numbers.